trade the direction of each 1 h candle using the macro PO3 indicator

session liquidity and goldbach time trade setups

time when and were the market swings are going to form by following the algopaths
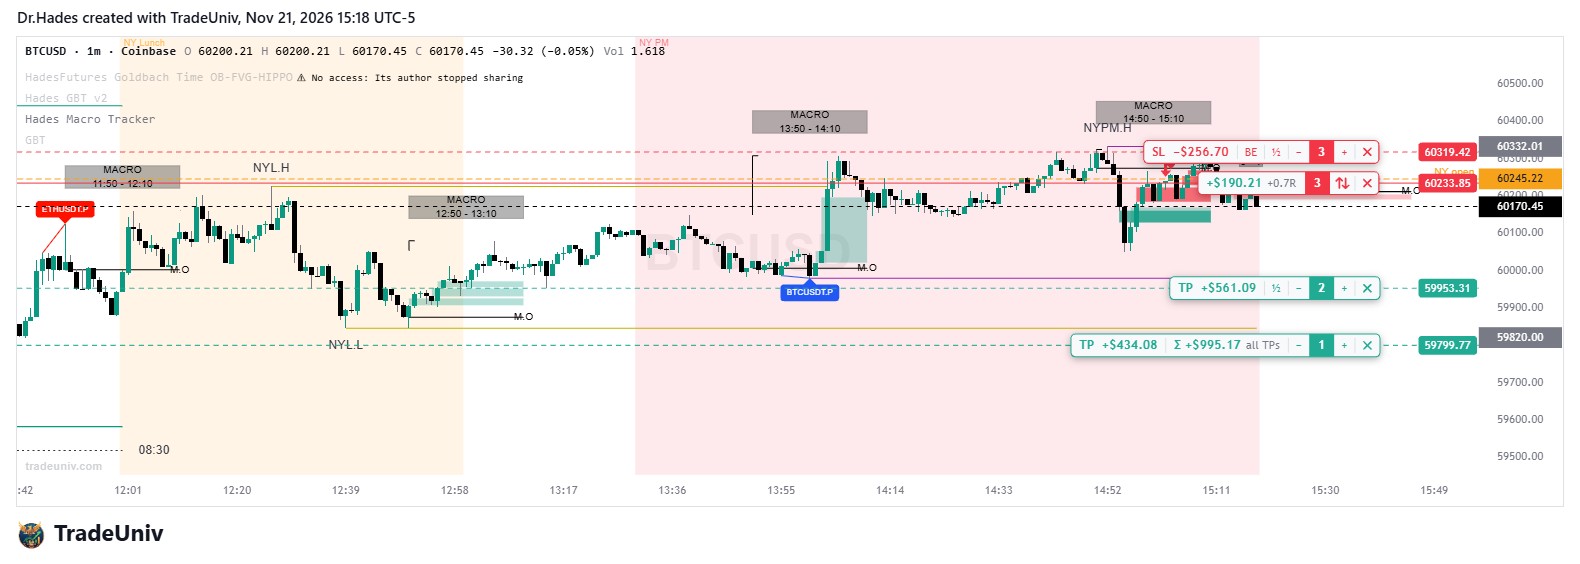
What you see on the chart Macro windows. Each enabled macro (for example 09:50โ10:10, 10:50โ11:10 or the 15:15โ15:45 PM macro) is shown as a labelled box. A line marks the macro's opening price, "M.O", so you can see whether price is trading above or below where the macro opened. Session liquidity. The highs and lows of Asia, London, NY AM, NY Lunch and NY PM are drawn as lines that stay on the chart until price takes them out. An optional alert fires when one breaks. Key opens. The True Day Open (00:00) and the 08:30 NY open are drawn as reference lines. FVGs inside macros. Fair value gaps are drawn only when they form during a macro. If price closes through a gap, it turns into an inverse FVG (IFVG) and changes colour. You get alerts for new bullish and bearish macro FVGs. SMT divergence. When your chart makes a new high or low inside a macro but ES or NQ doesn't, the swing is labelled with the symbol that diverged. Opening gaps. New Week (NWOG) and New Day (NDOG) opening gaps are drawn with their midpoint (C.E.), so you can see where price may react. How to use it Use a 1 or 2-minute chart. Macro drawings only appear on 2-minute and lower timeframes. Before the session, note which session highs and lows are still untouched and where the day open and opening gaps sit. These are your targets and your liquidity. As a macro starts, watch the macro open line. A common play is for price to run one of those session highs or lows during the macro and then reverse. Confirm the reversal with an SMT label, or with an FVG or IFVG forming inside the macro in the new direction. Enter on the retrace into that gap. Target the opposite session level or the midpoint of an opening gap. In short: it tells you when to pay attention (macros), where the liquidity is (session highs and lows, opens and gaps) and what to look for to confirm an entry (SMT and FVG/IFVG).

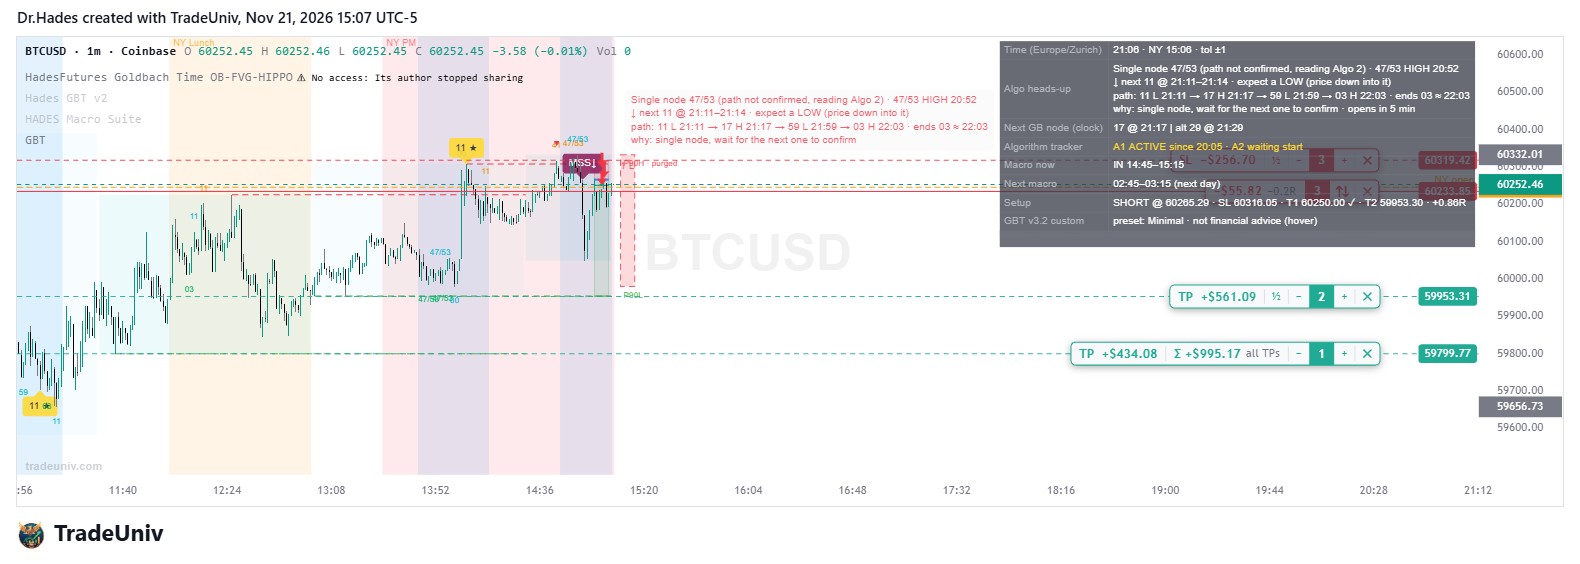
It is based on the idea that price runs on a clock. Some minutes of the hour, the Goldbach and CE times such as :00, :11, :17, :29, :41 and :47, tend to produce highs and lows. These turning points follow two repeating sequences, called Algo 1 and Algo 2. On top of that, Frank's model splits the New York day into 90-minute cycles and short "macro" windows where the bigger moves usually happen. How you use it during a session Open a 3, 9 or 27-minute chart of NQ, ES or gold. The indicator draws the 90-minute cycles, shades the macro windows and shows the previous session, day and week highs and lows. That's your map. Wait for a swing to be labelled. When price sweeps a recent high or low and turns, the swing gets a number such as 29 or 11. That number tells you which time node it formed on. A star means it started or ended an algo path. An A, B or C grade tells you how many factors line up. Read the heads-up. As soon as a swing is labelled, the indicator shades the time window of the next expected node and says what should happen there. For example: "after this low, expect a high around 10:17โ10:23." You now know when to pay attention and in which direction price should move. Get alerted. You don't need to watch the chart all day. An alert fires a few minutes before the next window opens, or when a key level is swept during a macro. Look for the entry. Inside that window, you want to see a high or low swept and then a strong close back the other way. If you turn on mechanical setups, the indicator marks the entry in the new fair value gap, plus the stop and two targets. Use grades as a filter. Trade only A or B swings that line up with a macro or a swept level, and skip the rest. In short: it turns a time-based method into a checklist on your chart, showing where you are in the cycle, when the next turn is due, which way it should go and whether the setup qualifies.